 Microsoft has been named a leader in Gartner’s 2025 Magic Quadrant for Analytics and Business Intelligence Platforms for the 18th consecutive year. Being a long time Microsoft partner and a provider of Power BI services, we are thrilled with this announcement. Tensoft has infused its solutions with Microsoft Power BI – built a link in between the two – so that it can used it as a standard industry product.
As you are aware, with Power BI you can combine multiple data sources, create custom workspaces online, mash up the data, split it, splice it and distribute it to your organization as needed. At Tensoft, we have created a nice template (a standard default file) that covers a lot of the basic reports on what customers in the semiconductor industry tend to need. We have highlighted some of these standard reports:
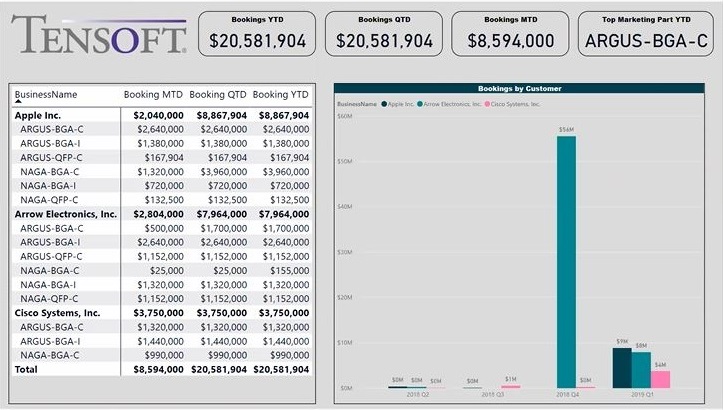
DO Bookings: This report is one way to split up your bookings and review that on monthly, quarterly and annual basis. These are all the bookings coming from Tensoft’s Sales Order modules. You can track changes to bookings every time someone is making an edit to a sales order, whether they add a new one or cancel a quantity, etc.

This report displays the Booking MTD (booking month-to-date), Booking QTD, and Booking YTD by customer, by item. On the right-hand side, you will see the bar chart with Bookings per quarter, per year by a customer. At the top, you will see a couple of cards displaying the totals for these different ranges and the top product. You can split that data in a couple different ways.
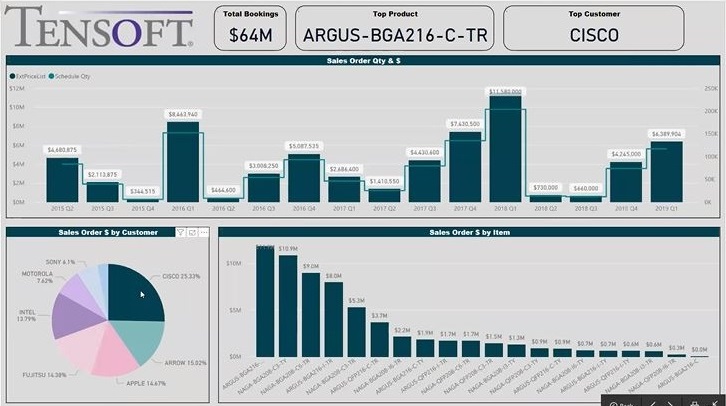
Sales Oder: The Sales Order is another way of tracking Bookings by date. At the top, you will see the Total Bookings, Top Product, and Top Customer. Power BI is interactive within each report’s tabs, so if you want to look at only one company, you can click on it and all your other visuals will be filtered out for you. If you want to look at 2018 Q1, you can do that and you will able to see all your items, the total dollar amount sold during that period and then what your customer breakdown was during that period. The cards at the top also filter as you move through and select different customers or items.

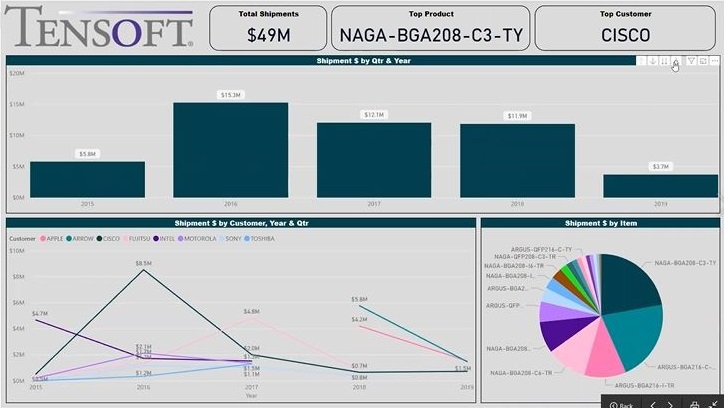
Shipments or Invoices: On this report, the cards at the top include Total Shipments, Top Product, and Top Customer. There is Shipment $ by Quarter and year with drilldown capability. If you click on the pitchfork, it will break it down for quarter for you. It also gives you the trend view by year per customer for Shipments by $ and then Shipments by Items. There is ability to apply filter to each one of these reports. If you expand the filter pane, you can click on things like dates, customer, family, items, quarter. Some of the reports do have slicers within the actual report.

Backlog: In this report, you will see your current Backlog in $, current Backlog in Quantity, and a breakdown of backlog, customer, item, document number and schedule number (what your internal commitment is). Tensoft products do allow you to split one customer sales order line into multiple delivery schedules and assign individual commits. With the help of this Power BI visual, you can forecast your revenue based on the internal commit, what you are expecting to ship in the future based on your commit dates and what’s the total value of both.