Continuing the previous blog post on some of the standard reports in Power BI:
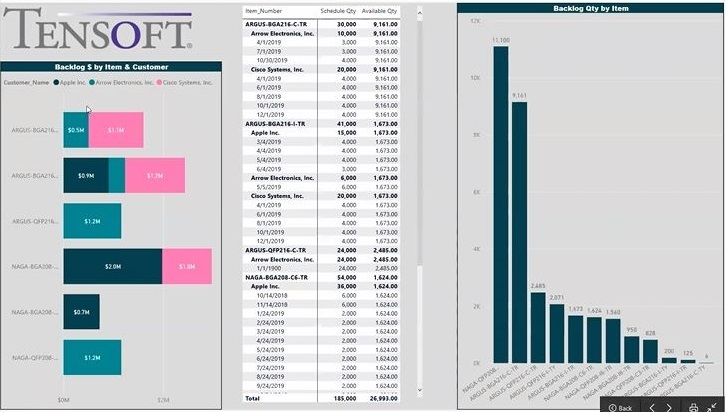
Backlog vs Inventory: This gives you a snapshot of what’s available today and what your backlog is. On the left-hand side, you will see the Backlog $ by Item and Customer and on the far-right hand corner, you have Backlog Quantity by Item and then in the middle, scheduled quantity and your available quantity.

Inventory: This report is an inventory grid. It gives all the details of your inventory- a nice breakdown of per lot, where it’s at, what stage, what’s the standard cost, inventory value and quantities. The cards at the top of the report give you sums per stage- FAB, SORT, ASSY, TEST, PACK and Total.
Inventory Value Aging: This report tells you how old your inventory is. It has a grid giving you all the stock dates, your lot numbers, your item numbers, and then Inventory $ by Stage and how much inventory are you holding by stage. If you drill down on the finished goods, it will show you the age of the inventory at the bottom (the different quarters).
Inventory Location: This report tracks the inventory location all the way down to the supplier facility. Most suppliers do have multiple facilities and multiple sites and we do track it all the way down to that level.
Procurement: This report is a detail of all your purchases- what have you purchased per quarter, per year, by process, what are your procurement trends, where is most of the cash going and details of that.
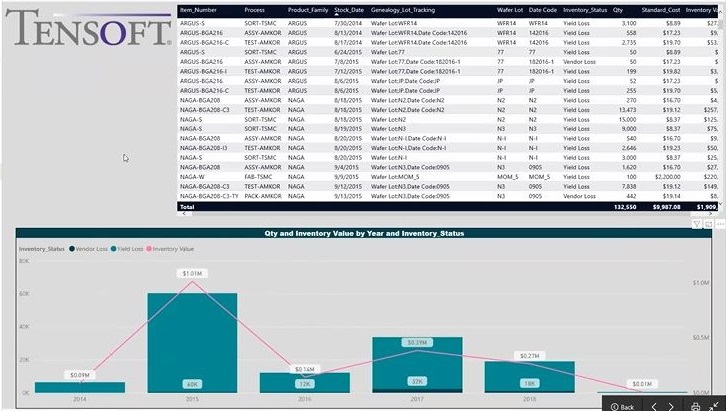
Yield: This report gives you a snapshot of everything’s that’s been yielded off, whether it’s vendor loss or yield loss. At the top, you will notice the specific yield data by item and by receipt and at the bottom you have Quantity and Inventory Value by Year and Inventory Status.

Cycle Time: With this report, you can track the Queue Time and Cycle Time per process, per item, and per period, however you want to split that up. Queue time being the difference between when you issue your production release to a vendor and the time they start, whereas cycle time being the time they start to the time to finish.
To learn how Tensoft SemiOps and Power BI has benefitted Tensoft customers, watch this customer case-study video. For additional details on how you can convert your data into insights with the help of Tensoft and Microsoft Power BI, click here.