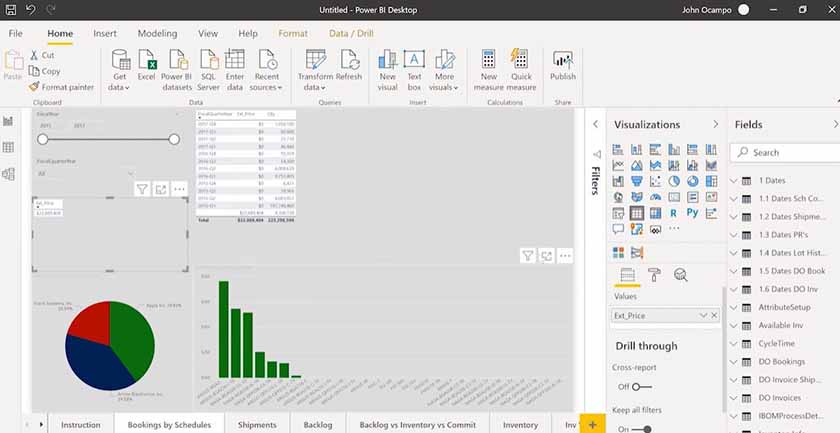
There are two interfaces to Power BI – Desktop App and Web App. The Desktop app is a desktop application that’s installed on your PC and the Web app is the one that can be accessed through a URL.
Desktop App
Most of the design work is done in the Desktop app. This is where you create the connections to the different systems, build the queries and create the visualization or appearance of the reports. Within the Desktop app, there are two different screens:
Query Editor Screen
On this screen, you set up your data sources and clean the data. The filtering and logic on this screen are similar to Excel.
Data Visualization screen
This is where you design how the data will be presented to users. It has multiple tabs-
- Fields: Listing of available data sets and fields
- Visualizations: Options for different table/chart views and formatting options
- Filters: Filters that can be applied to a single visual, entire page, or all pages
- Report View: This is what the final web report will look like for users
- Data View: This is the raw data behind each data set and is helpful to troubleshoot the data
- Relationships View: These are the relationships between different data sets
Almost 90% of the effort is in the Desktop app and the people who design the reports spend most of their time in this app.
Web App
Once you have completed your PBI report, you publish it to a “Workspace” in the Web app. You can assign users to the workspace who can access these dashboards and reports.
Schedule Data Refresh
Power BI is built to optimize server performance. It’s not a real time report and pulls the data in as of the last time it was refreshed. So, the reports are quick and it’s not hitting the performance. As a user working in Tensoft DemandOps or Dynamics 365 Business Central, for example, you aren’t being impacted by people querying the database multiple times a day.
You can create a refresh schedule easily. For example – if the data doesn’t move very often – you can schedule it to refresh once per day or sometime overnight. If it’s highly transactional and very time sensitive, you can set it to refresh a couple of times a day. You can also manually refresh it if needed.
Tensoft Power BI Dashboard
Tensoft has created a Power BI Dashboard containing 15+ standard reports for the Semiconductor/IoT industry. These reports cover everything from shipments to inventory to backlog vs inventory vs commit and much more. For additional information, click here.

To learn more about Microsoft Power BI, contact us.